Simple Life Real Estate Opportunity Fund, LLLP

Tile Image

Affordable, Adult Cottage Communities

Up to $32,000,000

($28,800,000 Available)

10% Preferred Return

Minimum Investment: $250,000

  • Large and growing cottage home demand - Moderate-income Gen Xers and Baby Boomer Retirees (45-70+) are migrating to Western NC and South Carolina, downsizing into highly affordable communities

  • Targeted residential solution - Simple Life bridges the affordability gap by offering high quality, very affordable ($119,000 to $239,000) cottage home communities in the Western Carolinas

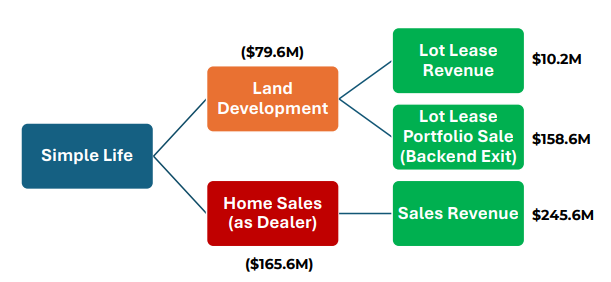
  • Compelling investor returns, 3 income streams: home sales, monthly lot-lease income, project sale (Initial project is pre-sold at a 4.5% cap rate)

  • Experienced sponsor: The Resource Group, LLC, Simple Life’s Sponsor, has already developed 2 comparable projects that were acquired by an institutional investor

  • Risk mitigation - extensive upfront land acquisition due diligence includes mandatory project-specific market studies as well as full entitlement, zoning, & permitting as a condition of land acquisition

Simple Life Solution: Custom Factory Built Homes/Lot Lease

SL Solution

Real Estate Opportunity

  • Supply of affordable age-friendly housing is severely constrained.

  • Over 30 million Baby Boomers are expected to downsize or relocate in the next decade.

  • Over 10,000 Baby Boomers retire daily, with a significant number relocating to the Southeast for affordability and quality of life.

Population Graph

  • Single person households are the fastest growing household segment representing 29% of total households.

US Households

  • The Asheville, NC and Greenville-Anderson, SC MSAs are top retirement destinations due to climate, healthcare, and cost of living.
Statistic Asheville, NC MSA Greenville-Anderson, SC MSA Simple Life Home Prices
Average Home Sales Price (Zillow) $484,000 $325,000 $180,000
Average Home Price to Average HH Income ($68,000) 7.1:1 4.7:1 2.64:1

Real Estate Solution

Simple Life Business Model

  • Solves the home affordability gap of Boomers/Gen X

  • Communities strategically located in lifestyle-rich areas - near medical care, retail, and transit

  • Fully amenitized, lifestyle-focused communities

  • 40–70 acre sites, 200–400 leasable lots.

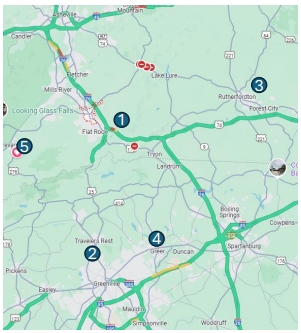
Project City, ST MSA Acreage Lots Dev Costs Cost Per Lot Capital Required Equity Funded
The Farm Flat Rock, NC Asheville, NC 11 60 $4,080,964 $68,016 6/25 $1,500,000
Equity Reserve Funding 8/25 $2,368,000
Mountain Grove Traveler's Rest, NC Greenville-Anderson, NC 60 193 $14,509,769 $75,180 9/25 $4,000,000
Rutherfordton Rutherfordton, NC Forest City, NC 50 280 $15,569,282 $55,605 10/25 $5,500,000
Equity Reserve Funding 3/26 $2,368,000
Tryon Tryon, NC Asheville, NC 50 300 $16,623,574 $55,412 4/26 $6,000,000
Windy Hill Flat Rock, NC Asheville, NC 50 280 $17,790,803 $63,539, 6/26 $6,000,000

Simple Life's Five Branded Communitites in Western NC and Upstate SC Will Feature:

  • Lot lease model (residents own homes, lease land)

  • Age-targeted community design (walkability, amenities, low-maintenance infrastructure)

  • High quality factory produced homes, built off-site, to high design and quality standards

  • Homes offered at prices below current housing prices - $119,00-$239,000

SL Locations

Investment Considerations

Real Estate Sector Comparison: Return on Cost, Exit Cap Rate, Yield Spread, Annual Returns, Sharpe Ratio

Sector Return on Cost (%) Exit Cap Rate (%) Yield Spread (%) Avg. Anuual REIT Return (%) Estimated Sharpe Ratio (%) Notes
Simple Life 9.25% 4.50% 4.70% n/a n/a
Manufactured Housing 7.50% 6.50-7.0% ~1.0-1.5% ~12.5% ~.6 Low volatility, high occupancy, essential housing; REITs include SUI, ELS
Multifamily ~6.0% ~5.0% ~1.0% ~9.3% ~.4 Garden-style or suburban apartments; cyclical in supply-sensitive markets
Retail ~7.0% ~6.0-6.4% ~.6-1.0% ~7.1% ~.3 Grocery-anchored preferred; volatility in inline tenants & legacy malls
Industrial ~6.5-7.5% ~4.25-5.2% ~1.3-2.5% ~10.5% ~.5 E-commerce tailwinds; low vacancy; REITs showing slightly rising volatility
Office ~8.0% ~7.0-8.0% ~0-1.0% ~4.1% ~.1 Remote work risj, tenant rollover, rising obsolesence
Hospitality ~9.0-10.0% 8.0-9.0% ~.5-1.0% ~6.8% ~.1 Short Lease Terms; highly cynical; limited-service hotels more suitable

The Sharpe Ratio is a risk-adjusted return metric used to compare the performance of different investments by measuring how much excess return an investment generates for each unit of risk taken - a higher ratio indicates a better risk-adjusted return. The figures described above concerning Simple Life's Return on Cost and Exit Cap Rates are management's best estimates on the Fund's operating metrics and not an indication or projection of individual investment performance.

Certain charts and other data presented herein have been compiled with the assistance of artificial intelligence. The prompts and data sources for such information are available in the diligence data room for this Offering.

Financial Highlights

  • Manufactured housing is generally accompanied by higher projected returns relative to other real estate asset sectors

  • 3 expected continuing sources of income, starting 2027

  • 10% preferred return + full return of invested capital returned before Sponsor/GP then receives 30% of additional net cash flow

  • Portfolio underwritten at a 15% return on cost – above market relative to other real estate projects

Competitive Advantage

  • Vertically integrated enterprise platform, track record, and extensive experience in developing factory-build custom housing communities

  • Simple Life’s solution to bridge the affordability gap via lower home prices ($119,000-$239,000) and the use of a lot lease business model

  • Strategic locations in proximity to key amenities – shopping, recreation, healthcare

Project Development - Site Selection

Simple Life is constantly pursuing potential land acquisitions that can be developed into high-performing, attainable cottage home communities. Their primary site selection criteria are shown below:

Site Selection

Each prospective development site is evaluated and ranked for its relative fit within their areas of focus shown in the following slide. Three of the five projects targeted by this fund are already under contract.

A more detailed description of the Sponsor Diligence Processes can be found in the Due Diligence Room.

Project Development - Due Diligence Summary

Simple Life follows a rigorous, repeatable process to identify, secure, and develop land into high-performing, attainable communities. This framework reduces risk during each phase, aligns with market demand, and supports investor confidence in long-term returns.

diligence process

A more detailed description of the Sponsor Diligence Processes can be found in the Due Diligence Room.

Project Development Plan

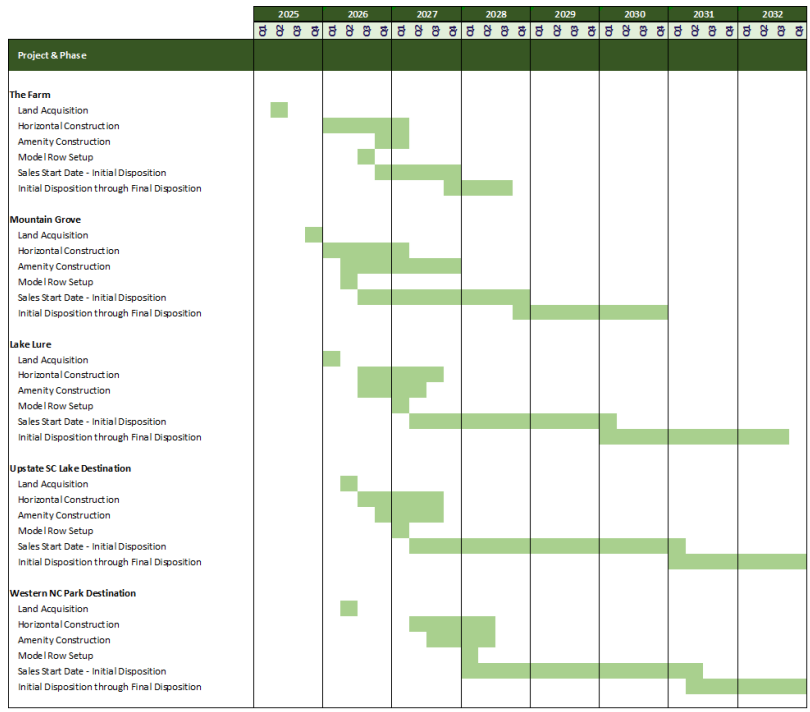
Vertically integrated enterprise platform, deep experience developing factory-built housing communities, and proven “rinse & repeat” execution process. Simple Life will develop five affordable, highly amenitized tiny home gated communities in key markets in Western NC and SC where the targeted demographic population is migrating and increasing unmet demand.

Key Milestones

  • Experience gained through 2 successfully completed Simple Life projects in North Carolina

  • 3 of the 5 sites under contract with the first closing scheduled for June 2025, targeting 1,100+ lots

  • Enhancement of the Simple Life “Enterprise” platform over the last 2 years of $1 million+ to increase its ability to scale and efficiently develop new communities utilizing a “rinse and repeat” process

  • Bridging the affordability gap via the combination of lower land costs, lower development costs and smaller home footprints, lot lease business model, and Simple Life’s wholesale buying power

Gantt Chart

Past performance is not a guarantee of future results.

Management Team

Management Team

Overall Sources & Uses of Capital (Budgeted)

Sources Total Per Unit
GP Equity $3,200,000 $2,875
LP Equity $24,536,082 $22,045
Senior Lender (12%) $44,015,471 $39,547
Seller Debt (If Applicable) $2,000,000 $1,797
Secondary Lender (8%) (If Applicable) $10,786,092 $9,691
Total Capital Stack $84,537,645 $75,955
CFB Homes Floorplan Lender (Revolvers) $9,000,000 $8,086
Customer Deposits $7,500,000 $6,739
Revenue Sources (RV Rent, Lot Rents, Home Deposits, Home Sales, Lifestyle Fees & Utility Bundles) $211,124,867 $189,690
Total Other Sources $227,624,867 $204,515
All Sources (Excluding Floorplan due to Repayment in Development Budget Cash Flow) $303,162,512 $272,383
Uses Total Per Unit
Acquisition Cost $24,282,082 $21,817
Due Diligence - Soft Costs $1,806,031 $1,623
Vertical Construction (Homes) $168,240,136 $151,159
Project Operating Costs / Payroll $24,623,817 $22,124
Onsites (Including Amenities) $57,867,788 $51,993
Financing/Related Charges $26,342,658 $23,668
Total Capital Stack Requirement $84,537,645 $75,955
Total Development Costs (TDC) including Home Building and Revenue Sources $303,162,513 $272,383

Simple life Business Model & Revenue Streams

Business model = 3 Revenues (Gross Total)

Business Model

Projected Fund Level Income Statement

All $ in Thousands 2024 2025 2026 2027 2028 2029 2030 2031 2032
Income Statement - Fund Model
Total Revenue 0.1 0.0 8,495.2 28,466.2 40,537.3 47,507.6 46,524.7 40,847.8 23,553.3
- - - - - - - - - -
Cost of Goods Sold - - - - - - - - -
Home Cost 0.0 (6,062.7) (19,904.1) (28,542.4) (33,335.1) (31,894.8) (29,731.9) (15,470.4)
Home WIP 2% Fee 0.0 (121.3) (398.1) (570.8) (666.7) (637.9) (594.6) (309.4)
Sales & Marketing Management (2%) 0.0 (161.6) (522.1) (713.6) (797.2) (736.2) (661.2) (383.0)
Total Cost of Goods Sold 0.0 0.0 (6,345.6) (20,824.3) (29,826.8) (34,799.0) (33,268.9) (30,987.7) (16,162.8)
Gross Margin After Commision 0.1 0.0 2,149.6 7,642.0 10,710.5 12,708.6 13,255.8 9,860.0 7,390.5
Gross Margin (%) - - 25.3% 26.8% 26.4% 26.8% 28.5% 24.1% 31.4%
Operating Expenses
Fixed & Variable Operating Costs, Taxes (49.2) (380.2) (1,036.2) (1,212.4) (1,296.3) (1,390.8) (265.2) 0.0
Sales and Marketing Expense (62.5) (1,167.6) (2,576.9) (2,517.9) (2,387.4) (2,333.6) (1,806.5) (907.0)
Amortization Expense 0.0 (453.1) (513.3) (465.7) (513.7) (436.5) (490.7) (260.2)
Depreciation Expense 0.0 (374.2) (755.0) (1,440.4) (1,156.7) (1,156.7) (1,156.7) 0.0
Total Operating Expenses 0.0 (111.7) (2,375.0) (4,481.5) (5,636.4) (5,354.1) (5,317.7) (3,719.2) (1,167.1)
Opex Ratio (%) - - 18.2% 12.7% 9.2% 7.8% 8.0% 5.1% 3.9%
Net Operating Income 0.1 (111.7) (225.4) 2,760.5) 5,074.1 7,354.5 7,938.1 6,140.8 6,223.4
NOI (%) - - -2.7% 9.7% 12.5% 15.5% 17.1% 15.0% 26.4%
Net Portfolio Sale Proceeds 0.0 0.0 0.0 5,760.0 18,975.2 3,541.7 30,055.7 74,321.4 21,176.0
Cost of Assets 0.0 0.0 0.0 (4,595.4) (15,730.2) (2,945.1) (18,827.0) (45,638.1) (13,046.0)
Gain on Investment 0.0 0.0 0.0 1,164.6 3,245.0 596.6 11,228.7 28,683.3 8,130.0
Net Income 0.1 (111.7) (225.4) 3,925.2 8,319.1 7,951.1 19,166.8 34,824.1 14,353.4

The preceding financial projections along with the performance estimates described on the following page reflect the Company’s best estimated forecasts and are not guaranteed to be accurate. The timing of performance is estimated post-funding. These figures are forward-looking statements and reflect the Company’s views about various future events or expectations. These figures take into account known and unknown risks, uncertainties and other factors and assumptions which may cause the Company’s actual results, performance or achievements to be materially different from any future results, performances or achievements expressed or implied by this forward-looking financial projection. Please see the note regarding forward-looking statements. And the “Risk Factors – Summary” for more information about the risks related to these projections. Additional details are available in the data room for further review.

Fund Level Net Income (Pro-Forma)

Fund Level Net Income

The preceding financial projections along with the performance estimates described on the following page reflect the Company’s best estimated forecasts and are not guaranteed to be accurate. The timing of performance is estimated post-funding. These figures are forward-looking statements and reflect the Company’s views about various future events or expectations. These figures take into account known and unknown risks, uncertainties and other factors and assumptions which may cause the Company’s actual results, performance or achievements to be materially different from any future results, performances or achievements expressed or implied by this forward-looking financial projection. Please see the note regarding forward-looking statements. And the “Risk Factors – Summary” for more information about the risks related to these projections. Additional details are available in the data room for further review.

Security Description

Issuer

Simple Life Real Estate Opportunity Fund, LLLP

Security Description

Limited Partnership Interests, 10% Preferred Return; 70/30 profit split (LP/GP) after LP investors receive their accrued preferred return & return of all invested capital

General Partner

Simple Life GP, LLC

Investment return drivers
  1. Home sales, 2) Monthly lot-lease income, & 3) Project sales (5 events)
Expected Investment Horizon

8 years

Minimum Investment

$250,000

Fund Size

$32 million ($28.8 Million Remaining)

Target Leverage

70%

Use of Funds

Property acquisition, site development, working capital through stabilization

Project Exit Strategy

Upon 65% occupancy, the sale of each project to institutional buyers with current income objective is planned

Due Diligence Room

Please sign in or get started to access the due diligence materials.

Risk Factors Summary

An investment in the securities described in this Summary involves certain risks. You should carefully consider all of the following risk factors, in addition to all of the information contained in this Summary and the PPM prior to investing in the securities. The risk factors described below are not the only ones facing the Company. Additional risk factors not presently known or that are currently deemed immaterial may also impair the Company’s business operations. The Company’s business, financial condition, results of operations or prospects could be materially and adversely affected by any of these risks. If any of the following risks occur, the Company’s business, financial condition or results of operations could be seriously harmed. In such case, an investor could lose all or part of its investment.

Risks Related to Simple Life

  • Changes in general business and economic conditions

  • The Partnership is dependent upon key management personnel, including those of Enterprises, which may not remain during the entire term of the Partnership

  • The Projects may not generate sufficient income to make distributions

  • No assurances can be given that, if developed, the Fund will be able to sell any Project

Risks related to Simple Life’s industry

  • Real estate investments are speculative by nature

  • Economic and regulatory changes that impact the real estate market generally may decrease the value of the Partnership’s real estate investments and weaken the Partnership’s operating results

  • Investments in manufactured home communities have special risks

  • The Partnership depends on the accuracy and completeness of information from third parties, and inaccuracies in such information could adversely affect profitability

Risks related to this offering

  • No regulatory authority has reviewed this offering

  • A Limited Partner will have no management rights or control over changes in the Partnership’s asset allocation, and will waive certain legal rights, which increases the uncertainty and risks faced by a Limited Partner

  • There are Certain Conflicts of Interest between the Fund, the Asset Manager, Enterprises, and the General Partner

The list of Risk Factors above is non-exhaustive and any potential investor should review the “Risk Factors” section of the PPM for additional risks and a discussion of all risks identified therein.

Preliminary Communication

This communication (the “Summary”) was prepared by Carofin, LLC (the “Placement Agent”) with information provided by Simple Life Real Estate Opportunity Fund, LLLP (the “Company”) for the sole purpose of allowing the Placement Agent to identify whether enough demand for the securities described herein exists within its investor base. No money or other consideration is being solicited, and if sent in response, will not be accepted. A person’s indication of interest involves no obligation or commitment of any kind. No offer to buy the securities can be accepted and no part of the purchase price can be received until any potential investor receives and reviews a private placement memorandum (the “PPM”) more fully describing the securities.

Additional information contained in such PPM may include, but not be limited to (i) the financial condition of the Company, (ii) the terms of the securities, (iii) the use of proceeds from the sale of the securities, (iv) the background of the Company’s management, (V) relevant litigation, (vi) certain related party transactions and conflicts of interest, and (vii) risks concerning the securities. THIS SUMMARY IS QUALIFIED IN ITS ENTIRETY BY THE CONTENTS OF THE PPM.

Please see “Important Disclosures” for other important information concerning this Summary and the securities described herein.

Caution Regarding Forward-Looking Statements

This Summary contains forward-looking statements that are based on the Company's current views and assumptions and involve a number of risks and uncertainties that could cause actual results to differ materially. These statements include, but are not limited to, projections of its operating and financial metrics. These forwardlooking statements are typically identified by terms and phrases such as "anticipate," "believe," continue," "could," "estimate," "expect," "intend," "may," "plan," "predict," "project," "should," "will," and similar expressions.

These forward-looking statements, wherever they occur in this Summary, are estimates reflecting the best judgment of the management of the Company. These forward-looking statements involve a number of risks and uncertainties that could cause actual results to differ materially from those suggested by the forward-looking statements. Forward-looking statements should, therefore, be considered in light of various important factors, including those set forth under "Risk Factors" and elsewhere in this Summary and the PPM. The Company has no obligation to revise or update any forward-looking statement for any reason.

Important Disclosures

These securities have not been registered with the Securities and Exchange Commission (the "“SEC” or the “Commission”), or with any state securities commission or any other regulatory authority. The securities are being offered in reliance upon an exemption from the registration requirement of federal and state securities laws and cannot be resold unless the securities are subsequently registered under such laws or unless an exemption from registration is available. Neither the SEC nor any other agency has passed on, recommended or endorsed the merits of this offering (this “Offering”) or the accuracy or adequacy of this Summary. Any representation to the contrary is unlawful.

These securities are offered through Carofin, LLC, Member of FINRA/SIPC. Carolina Financial Securities is an affiliate of Carofin and both Broker-Dealers are affiliates of Carolina Financial Group, LLC. Documents have been prepared by Carolina Financial Securities and have been reviewed and approved by the management of the Company. The information contained herein has not been independently verified and is dependent on information provided by the Company to Carolina Financial Securities, LLC.

Our firms seek to present vital capital with meaningful investment opportunities through the fundamental analysis of the businesses we seek to finance. Such analysis is usually conducted through a First Principles approach.

When we provide you with a recommendation, we have to act in your best interest and not put our interest ahead of yours. At the same time, the way we make money creates some conflicts with your interests. You should understand and ask us about these conflicts because they can affect the recommendations we provide you. Here are some examples to help you understand what this means:

Proprietary Products: Our firms will often present investments that are only available through them, which may result in a higher placement fee. The Firms will receive the placement fee regardless of your investment performing as expected.

Our firms offer brokerage services to accredited investors, exclusively through the sale of private placements. the offerings we bring to market are carefully selected, and any recommendation you may receive from us will be limited to these offerings. Therefore, we may be unable to adequately compare the risks and benefits of the offerings we bring to offerings presented by other financial professionals. While our firms will often present new investments and discuss such investment’s risks and benefits with you, the ultimate authority to make such investment rests solely with you.

Our firms do not hold any investor cash or securities, and securities offered by us often have no easily assessable market value, so our firms will not monitor the market value of your investment on an ongoing basis. The investments we present often require a minimum investment of $5,000 for equity offerings and $10,000 for debt offerings.

Fees and costs may reduce any amount of money you make on your investments over time. Our firms are mostly compensated through placement fees, which are payable by the issuer, meaning that the firms will be compensated by receiving a percentage of the funds raised in an offering, regardless of the investment performing as expected. Such placement fee is usually between 3% and 7%. Given that different investments have different placement fees, we may often have a conflict of interest when presenting these investments to you. The Firms’ bankers are often compensated by receiving a percentage of the placement fee, and may have their own conflict of interest when presenting you with offerings they structure.

Private placements are high risk and illiquid investments. As with other investments, you can lose some or all of your investment. Nothing in this document should be interpreted to state or imply that past results indicate future performance, nor should it be interpreted that FINRA, the SEC or any other securities regulator approves of any of these securities. Additionally, there are no warranties expressed or implied as to accuracy, completeness, or results obtained from any information provided in this document. Investing in private securities transactions bears risk, in part due to the following factors: there is no secondary market for the securities; there is credit risk; where there is collateral as security for the investment, its value may be imped if it is sold. Please see the Private Placement Memorandum (PPM), and the complete list of contents of this Offering Package for a more detailed explanation of the securities Summary of Terms, Investor Suitability Standards, Confidentiality, Securities Matters and Risk Factors.

Connect With Our Team
Relationship Summary (Form CRS)

Carolina Financial Securities, LLC and Carofin, LLC (“CFS” and “Carofin”, respectively) are affiliated broker-dealers registered with the Securities and Exchange Commission and members of FINRA and SIPC. The fees and services broker-dealers offer differ across the industry and it is important for you to understand such differences.

Free and simple tools to research firms and financial professionals are available at Investor.gov/CRS, which also provides educational materials about broker-dealers, investment advisers, and investing.

You will find certain pertinent questions you may ask us when first establishing a relationship listed as “conversation starters” below. We invite you to visit our Knowledge Base for educational materials on private investments.

What investment services and advice can you provide me?

Our firms offer brokerage services to accredited investors, exclusively through the sale of private placements. A private placement is an offering of securities that is exempt from registration with the Securities and Exchange Commission and carries significant risks, which may result in the loss of some or all of your investment. Such risks include, but are not limited to, the inability to sell your investment for cash, the lack of publicly available information on the company issuing the security, and no guarantees of returns or periodic payments.

Our firms carefully select the offerings they bring to market, and any recommendation you may receive from us will be limited to these offerings. Therefore, we may be unable to adequately compare the risks and benefits of the offerings we bring to offerings presented by other financial professionals. While our firms will often present new investments and discuss such investment’s risks and benefits with you, the ultimate authority to make such investment rests solely with you.

Our firms do not hold any investor cash or securities, and securities offered by us often have no easily assessable market value, so our firms will not monitor the market value of your investment on an ongoing basis. An affiliate of CFS and Carofin, CFG Financial Services, does, however, act as administrative agent for many offerings we bring to market. In this role, CFG Financial Services will monitor an issuer’s compliance with its obligations, make distributions of periodic payments, and, when necessary, intervene in the event that things are not going to plan. When this happens, CFG Financial Services is often compensated by part of the proceeds recovered in settlement or bankruptcy proceedings, which may reduce the return on your investment.

The investments we present often require a minimum investment of $5,000 for equity offerings and $10,000 for debt offerings.

Conversation Starters:
  • Given my financial situation, should I choose a brokerage service? Why or why not?
  • How will you choose investments to recommend to me?
  • What is your relevant experience, including your licenses, education, and other qualifications? What do these qualifications mean?

What fees will I pay?

You will pay fees and costs whether you make or lose money on your investments. Fees and costs may reduce any amount of money you make on your investments over time. Please make sure you understand what fees and costs you are paying.

Our firms are mostly compensated through placement fees, which are payable by the issuer, meaning that the firms will be compensated by receiving a percentage of the funds raised in an offering, regardless of the investment performing as expected. Such placement fee is usually between 3% and 7%. Given that different investments have different placement fees, we may often have a conflict of interest when presenting these investments to you.

Given that our placement fees are payable by the issuer, the full amount of your investment will be used to purchase debt or equity securities, even though a certain amount of the proceeds may be immediately redirected by the issuer to CFS and Carofin as placement fees.

Conversation Starters:
  • Help me understand how these fees and costs might affect my investments. If I give you $10,000 to invest, how much will go to fees and costs, and how much will be invested for me?

What are your legal obligations to me when providing recommendations? How else does your firm make money and what conflicts of interest do you have?

When we provide you with a recommendation, we have to act in your best interest and not put our interest ahead of yours. At the same time, the way we make money creates some conflicts with your interests. You should understand and ask us about these conflicts because they can affect the recommendations we provide you. Here are some examples to help you understand what this means:

Proprietary Products: Our firms will often present investments that are only available though them, which may result in a higher placement fee.

Management Fees: Our firms will often present investments in which Carolina Financial Group, LLC an affiliate of CFS and Carofin, acts a manager of the company. CFG will often be compensated for such services.

Warrant Position: Our firms will often receive a warrant (an option to purchase an equity security in the future, for a defined price) for certain securities. Given that our firms, or other equity holders in the company, may have an investment time horizon that differs from yours, this may create a conflict of interest.

Equity Trust Company Relationship: Carofin and Equity Trust Company (“ETC”) have entered into an agreement by which Carofin exclusively promotes ETC’s services as IRA custodian, in exchange for the sharing of certain Carofin content by ETC. You can learn more about the services ETC offers, along with the fees associated with such services, at trustetc.com.

Conversation Starters:
  • How might your conflicts of interest affect me, and how will you address them?

How do your financial professionals make money?

Our firms have different compensation structures.

CFS financial professionals, which are often the individuals working with the company to structure an appropriate security, receive a percentage of the placement fee received by CFS in the investments they structure. Therefore, these professionals have an interest in presenting you with the investments they have structured.

Carofin financial professionals, on the other hand, are the individuals responsible for understanding and presenting these investments to you. While Carofin professionals are compensated through discretionary bonuses, they may have an interest in presenting you with investments which may result in a higher placement fee to the firm overall.

Do you or your financial professionals have legal or disciplinary history?

Yes. You have access to a free and simple tool to research our firms and financial professionals at Investor.gov/CRS.

Conversation Starters:
  • As a financial professional, do you have any disciplinary history? For what type of conduct?

Additional Information

You may learn more about our brokerage services and request a copy of this relationship summary at Carofin.com. You may also contact us directly at 828.393.0088 or [email protected] to request up-to-date information and a copy of this relationship summary. We also encourage you to visit our Knowledge Base for additional educational information on private investments.

Conversation Starters:
  • Who is my primary contact person? Is he or she a representative of an investment adviser or a broker-dealer? Who can I talk to if I have concerns about how this person is treating me?

Form CRS – October 12th, 2020, Ver. 2.0